
Course Overview
Course Details
-
Formulas and Functions
-
Advanced Chart Features
-
Presenting Data Visually
-
Data Analysis
-
Macros and Forms
-
Linking Workbooks & Summarizing Data
-
Entity-Relationship Model & Normalization
-
Introduction to SQL Server 2019
-
Creating and Managing Databases
-
Azure SQL
-
Advanced Queries and Joins
-
Views, Stored Procedures & Metadata
-
Connect and Shape
-
Data Analysis Expressions
-
Visualizations in Power BI
-
Power BI Service
Course Duration
Eligibility
-
10+2/ College students/ Undergraduates/ Graduates
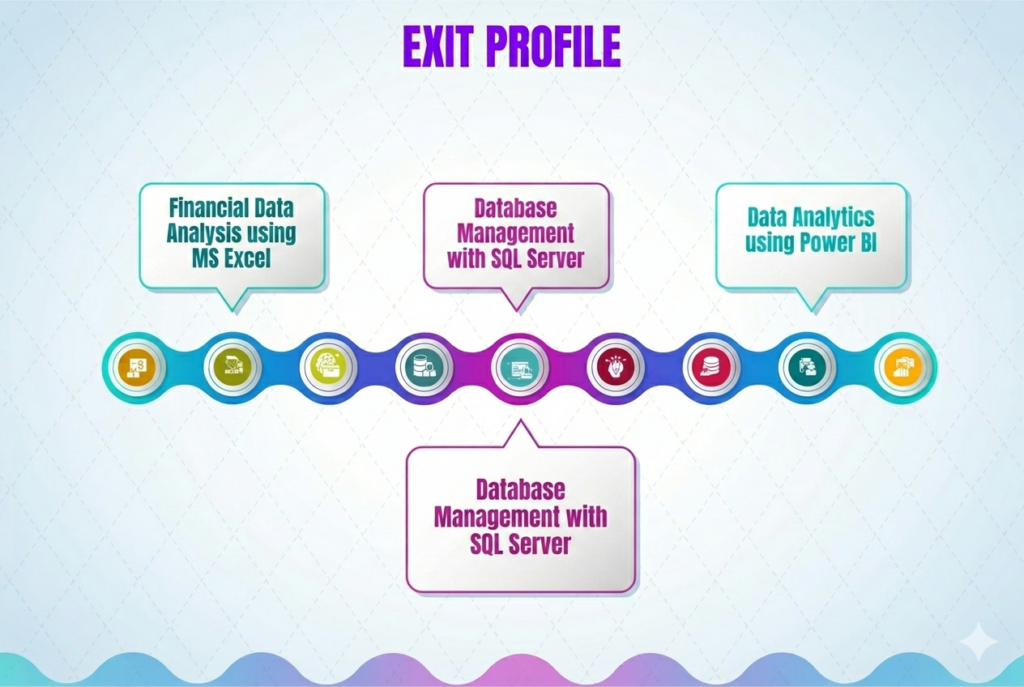
Exit Profile
-
Power BI Developer: Design, build, and deploy interactive enterprise-level dashboards using Power BI and DAX to drive data-backed business decisions.
-
Data Analyst: Extract, clean, and analyze complex datasets using SQL Server and Advanced Excel to identify business trends and insights.
-
MIS Analyst (Management Information Systems): Manage database structures and automate daily, weekly, and monthly corporate reporting using Excel Macros, Advanced Formulas, and Forms.
-
Financial Data Analyst: Build financial models, perform budgeting and forecasting, and analyze financial statements using specialized MS Excel tools.
-
Business Analyst (Data-Driven): Bridge the gap between IT and business operations by translating technical data insights into actionable business strategies.
Our Other Courses
-
Smart Pro OST
-
Aptech Certified Python Developer
-
Smart Pro Artificial Intelligence & Machine Learning
-
Smart Pro Data Science
-
Smart Pro IoT
-
Smart Pro Android
-
Smart Pro-.NET Web Application Development
-
Smart Pro-Java Web Application Development
-
Smart Pro Digital Marketing
-
Smart Pro User Interface & Experience Design
-
Smart Pro E-commerce
-
Smart Pro Data Visualisation